- There is JNIDebug java project, which contains java class Example:
public class Example {

static {
  System.loadLibrary("example");
}

private native int getValue();

public static void main(String[] args) {
  final Example example = new Example();
  System.out.println("value is:" + example.getValue());
}
} - Create Managed Make C Project with project name JNI, select project type Cygwin DLL and Debug Configuration.
- Write the following code to c/example.c:
#include <jni.h>
#include <stdio.h>

#include "Example.h"


/*
* Class:     Example
* Method:    getValue
* Signature: ()I
*/
JNIEXPORT jint JNICALL Java_Example_getValue
(JNIEnv *env, jobject jobj)
{
printf("hello from jni/c!\n");
return 1;
} - Set the following properties of JNI project:
- C/C++ Build
- GCC C Compiler
- Directories
- add $(JAVA_HOME)/include and $(JAVA_HOME)/include/win32
- Miscellaneous
- other flags: -c -mno-cygwin
- GCC C Linker
- Miscellaneous
- other flags: -mno-cygwin -Wl,--add-stdcall-alias
- Shared Library Settings
- Shared (-shared) should be switched on
- Build settings
- Artifact name: example
- Artifact extension: dll
so, have to Build project JNI. - Well, there are two projects: java project JNIDebug and managed make C project JNI, have the following structure:
- Create debug entries in eclipse
- Now start debug entry JNI.
Put a break point somewhere in native code.
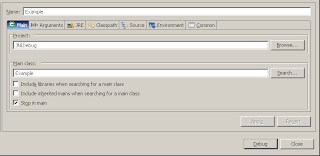
Create java application debug launch configuration: choose project JNIDebug, main class Example and check on Stop in main

Start this debug configuration, vm will suspend on main().
When, create C/C++ Attach to Local Application debug configuration with name JNI: select temporary C/C++ project, select C/C++ Application native/example.dll through Browse option. In Debugger tab select Cygwin GDB Debugger - gdb or full path to gdb if it is not in the PATH environment variable,

After start debugging it is necessary to attach to java application process. It's necessary to remember eclipse javaw.exe pid before start application. It's not actually for eclipse >= 3.3 as it not start javaw.exe process. Select javaw.exe pid according to our application.
- We'll stopped on some system dll position due to java application suspended on break point. Press Resume in gdb process
 and when Resume in Java Application process.
The final :
alternative way with Makefile:
JAVAH=$(JAVA_HOME)/bin/javah
BUILD_PATH=build/classes

all: Example.h native/example.dll

Example.h: $(BUILD_PATH)/Example.class
$(JAVAH) -classpath $(BUILD_PATH) -d src/c Example

native/example.dll: src/c/example.c
gcc -mno-cygwin -I$(JAVA_HOME)/include -I$(JAVA_HOME)/include/win32 -g -Wl,--add-stdcall-alias -shared -o $@ $<


2 комментария:
As well you can use text mode debugging with console gdb:
Start in debug mode java application, suspend on java break point, when start gdb:
$ gdb example.dll
attach to the process
(gdb) attach pid
add break point source.c:line
(gdb) break example:12
(gdb) cont
and when continue java debug execution.
sometimes it is necessary know what commands eclipse send to gdb.
start eclipse as:
$ eclipse -debug "full path to .options"
where .options is :
debug=true
org.eclipse.cdt.core/debug=true
org.eclipse.cdt/debug=true
org.eclipse.cdt.debug.mi.core/debug=true
Отправить комментарий